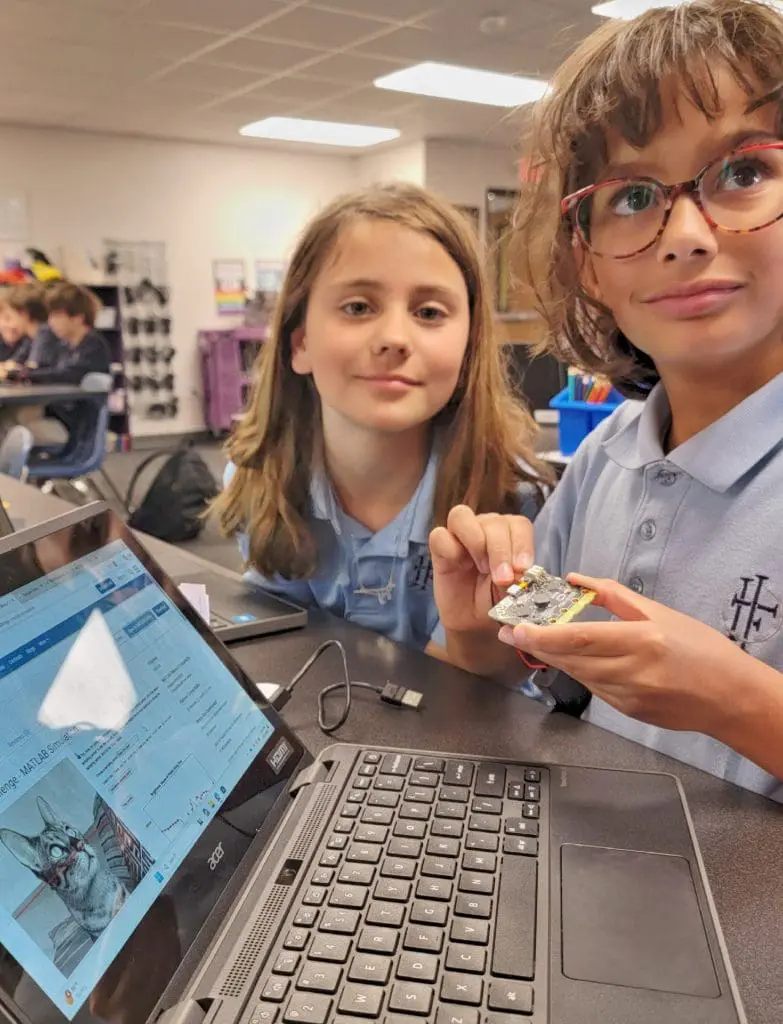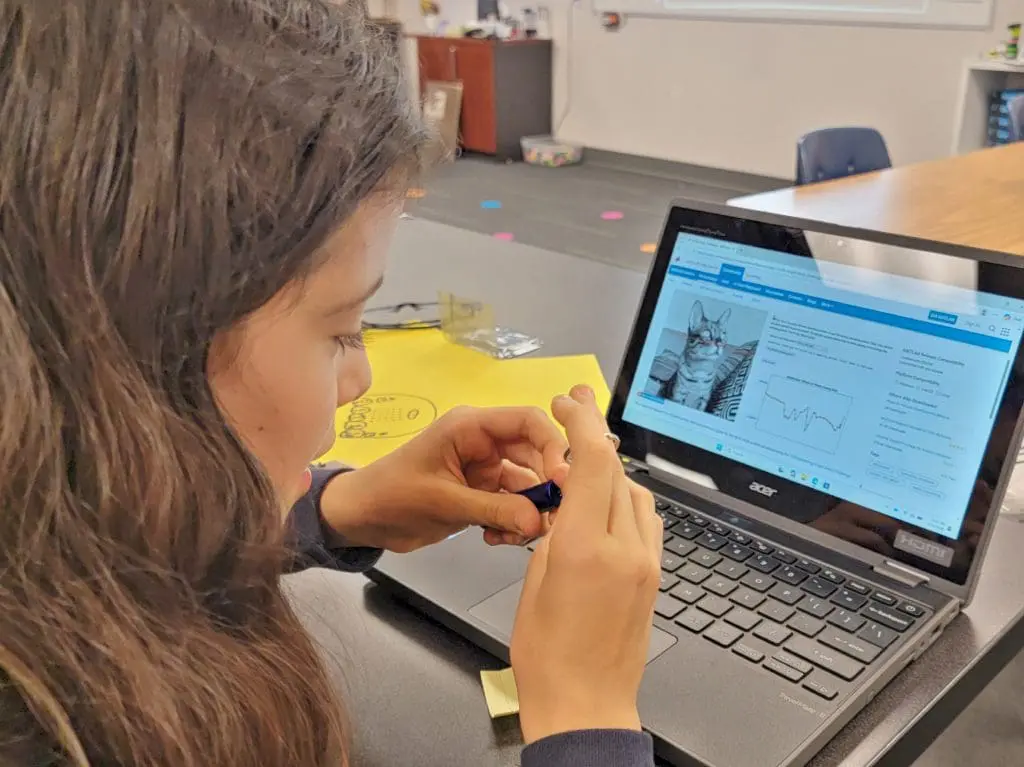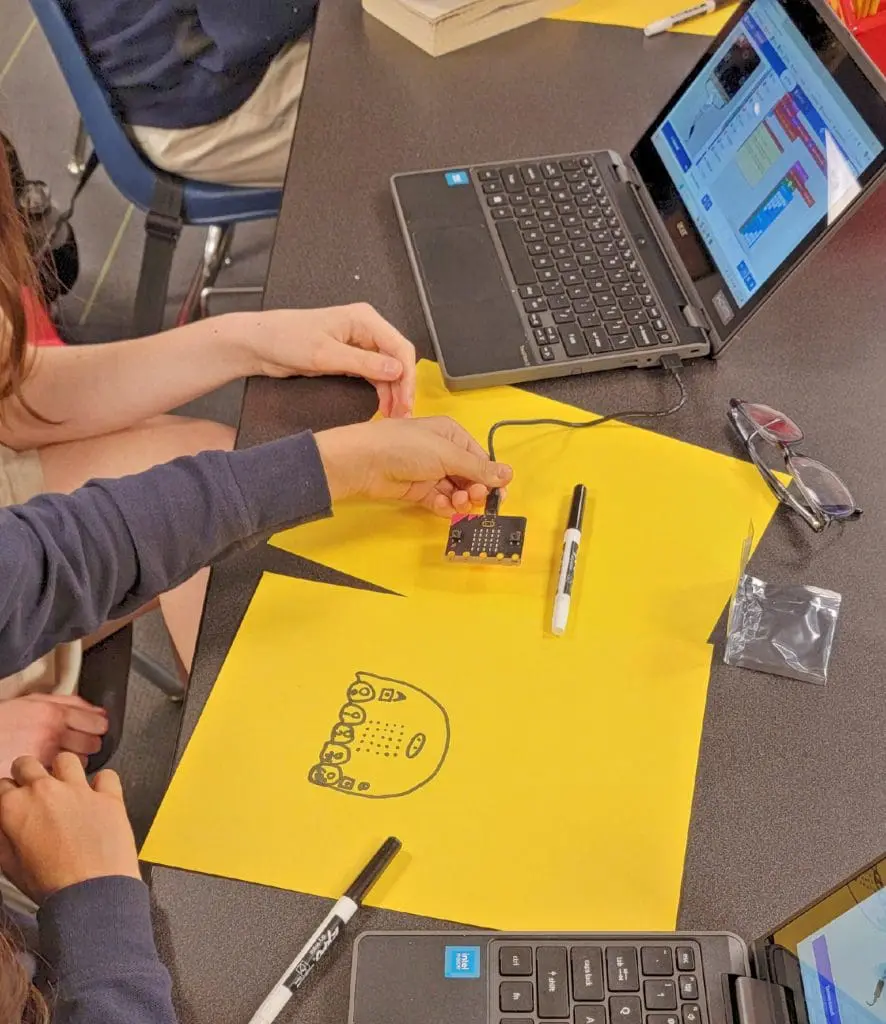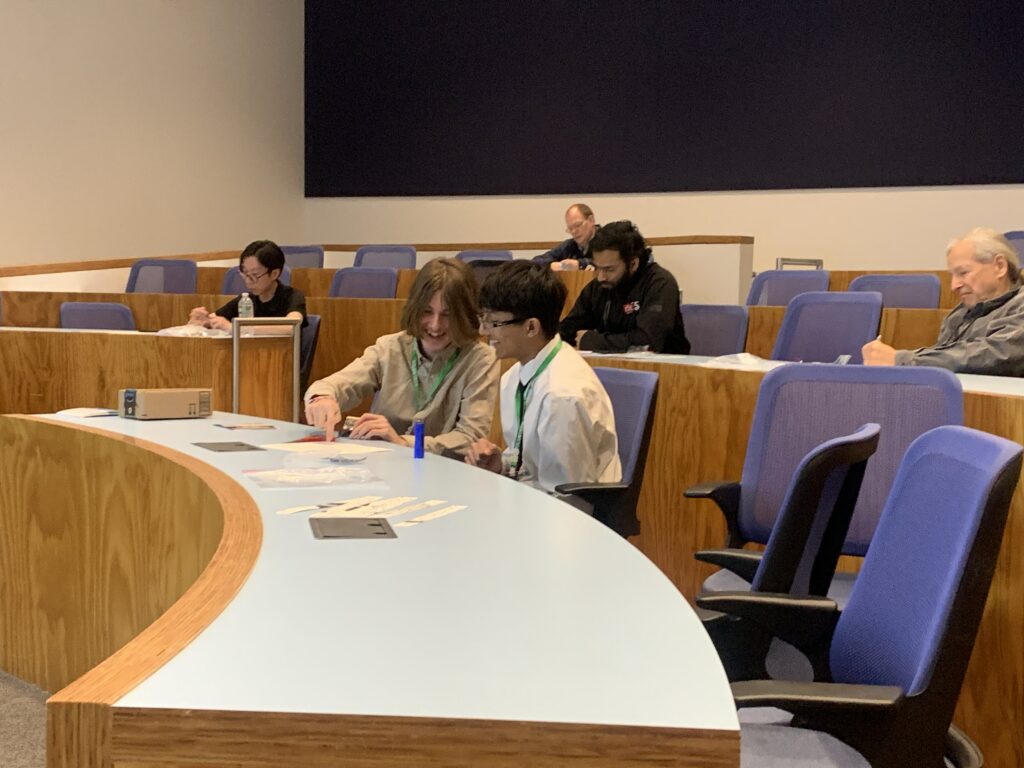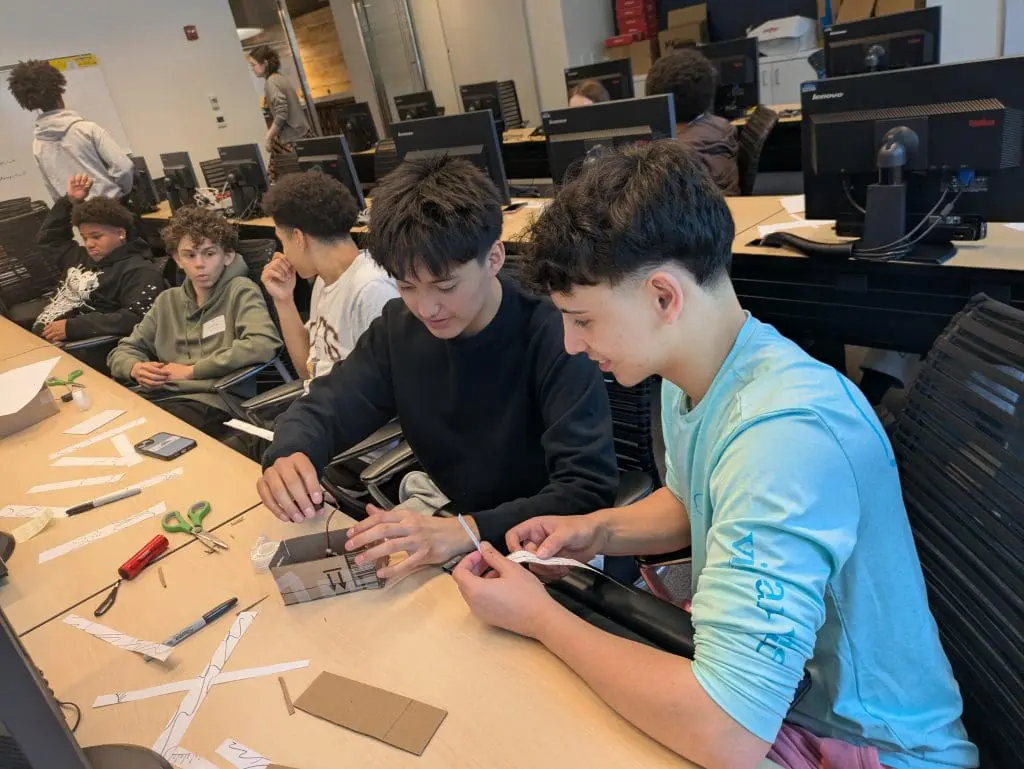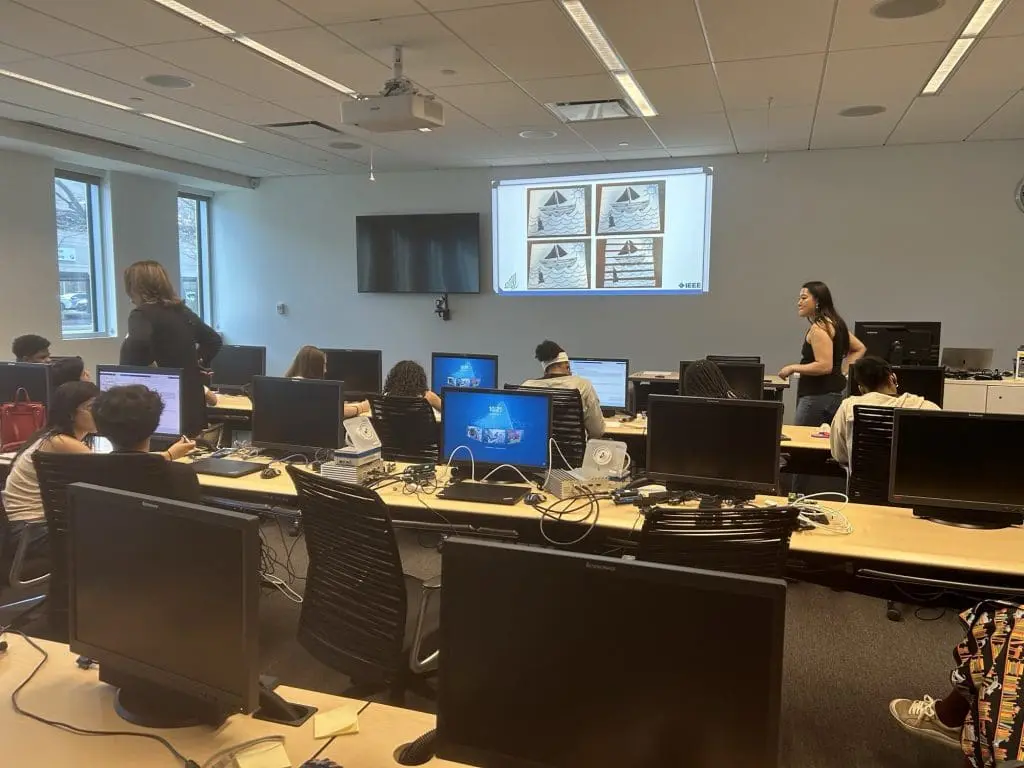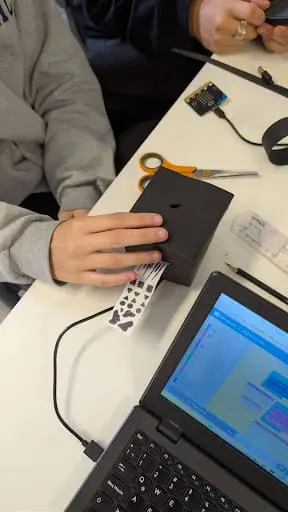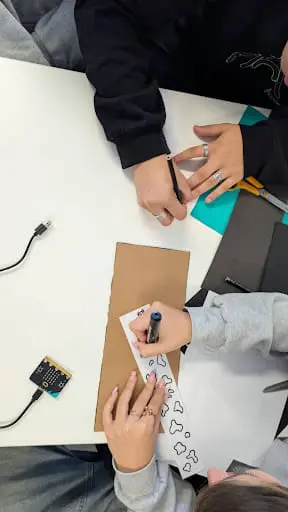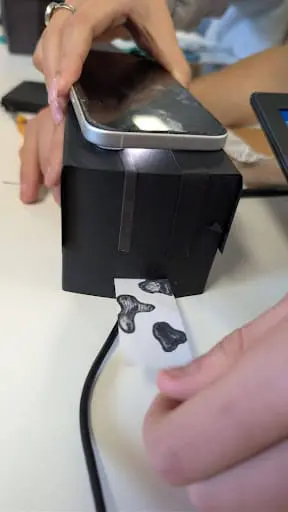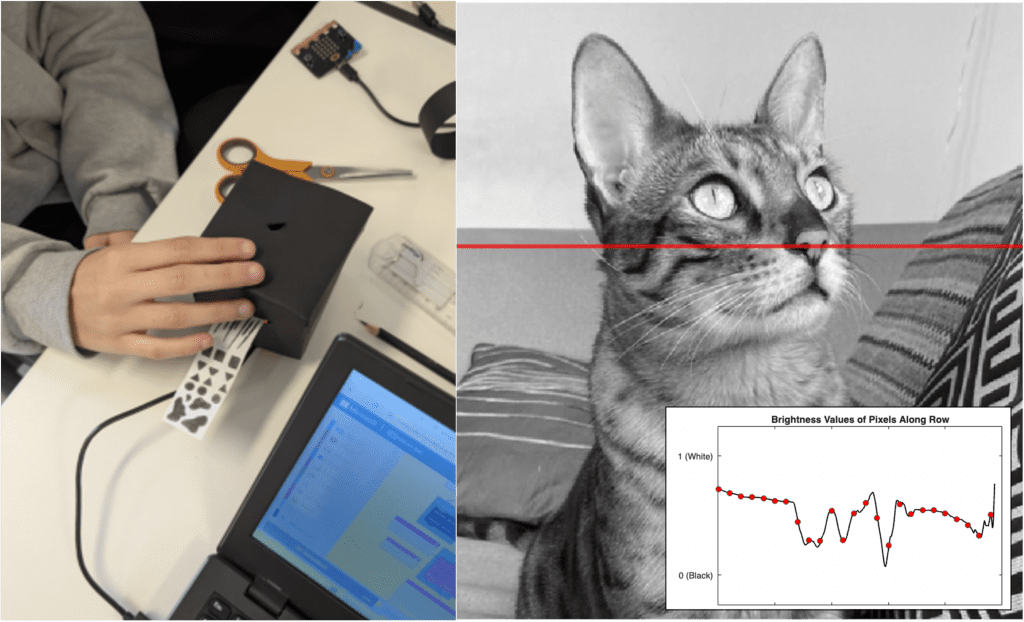

In the Bright Beats Challenge, you will create a light-sensitive musical synthesizer using a micro:bit to transform light levels into musical notes, demonstrating how a micro:bit could be used to ‘read’ a black-and-white image with sound. Students will be introduced to concepts in signal processing as they build a tool that can translate visual signals into audio signals, allowing users, such as those who are visually impaired, experience photos in a new and unique way.
In the accompanying MATLAB activity, you will turn pixels from digital images into piano notes. In the process, you’ll uncover the power of computers and programs like MATLAB for transforming visual and audio signals through signal processing and learn how images are represented by computers. Building upon the micro:bit activity with the power of MATLAB, you’ll be able to customize the sounds further and translate more complex images into sounds.
Learning Outcomes
Students will:
- Understand how light intensity can be used to control outputs
- Learn how to map light intensity data to musical frequencies
- Gain experience in the graphical interpretation of light intensity data vs time
- Develop skills in iterative design and testing
- Understand how digital images are represented numerically by computers and programming environments like MATLAB
- Recognize and practice how information can be encoded as one signal (visual) and decoded as another (sound)
- Analyze how different systems (micro:bit vs MATLAB) interpret and convert different versions of the same visual signal, and discuss factors that affect accuracy and fidelity
- Define the concept and value of smoothing as a signal processing technique
- Define the concept and value of choosing an appropriate sampling period as an important step in signal processing
Lesson Plan Presentation
Materials & Preparation
- Computer (1 per team of 2 kids)
- 1 micro:bit v2 (per team) with battery pack
- MATLAB: The MATLAB Online (basic) platform opens directly in a browser window, allowing you to seamlessly engage in any activity that piques your interest. This platform is free to use for up to 20 hours/month. Additionally, you will have access to 5GB of MATLAB Drive, so that you can upload files directly from your device for use with MATLAB.
- If you haven’t already, create a MathWorks account
- Visit the MATLAB Activity Page, and click ‘Open MATLAB Online’
- Follow the step-by-step instructions in ‘BrightBeatsChallenge_Student.mlx)
- MATLAB Activity Instructor Guide
- White paper, black marker, and colored markers
- Printed black and white image
- Mini flashlight, head lamp, or cell phone light
- Cardboard or Cardstock
- Tape/Glue
- Rubber bands
- Scissors
- Other fun decorative items for the device (pipe cleaners, etc).
- TryEngineering Signal Processing Video
- Wave Wonders: A Signal Processing Journey E-book
- TryEngineering Signal Processing Collection
- Instead of printing an image or drawing it other options include:
- Pixel Art www.pixilart.com (digital option) or https://www.piskelapp.com/kids/
- Barcode Creator: various apps available (optional)
Engineering Design Challenge
In Part 1 of the Bright Beats Challenge, you will create a light-sensitive musical synthesizer using a micro:bit that transforms light levels into corresponding musical notes, giving users a unique way to experience photos by “hearing” them. In Part 2, you will use the accompanying MATLAB activity to turn pixels from digital images into piano notes.
Criteria
- Light Detection: Use the micro:bit’s light sensor to measure ambient brightness.
- Sound Mapping: Program musical notes that correspond to specific light levels.
Constraints:
- Must use only onboard micro:bit components (no external sensors or speakers).
- The system must operate continuously without manual resets.
Activity Instructions & Procedures
-
Hook with Braille
- Introduce your kids to Braille by showing an image or a real sample (if possible) and ask if they know what it is, who uses it, and what it is used for. See info below.
- Watch: The incredible story of the boy who invented Braille | BBC Ideas,
- Connect to our challenge: Similar to Braille, in the “Bright Beats Challenge,” those who are visually impaired can “read” an image with sound by using a micro:bit to translate the light and dark areas of a black-and-white image into musical tones. This process essentially creates a sensory bridge, translating light into sound.
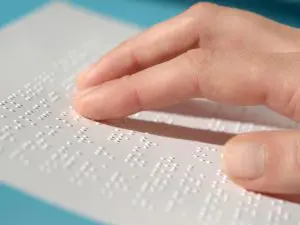
Braille is a special way that people who are blind or visually impaired can read and write using their fingers. It’s not a language itself, but a code that represents letters, numbers, and symbols.
How it Works: Braille uses a system of raised dots arranged in “cells”. Each cell has six dots in two columns of three dots each. Different patterns of these raised dots stand for different letters, numbers, or punctuation marks. For example, the letter “A” is a single raised dot in the top left corner. Readers feel these dot patterns with their fingertips to understand what is written.
- Who Invented It: Braille was invented by Louis Braille in France in 1824. He developed this system while he was a student at the National Institute for Blind Youth in Paris.
- Why It’s Important: Learning Braille from a young age has many benefits for children with vision impairment. It helps with literacy, including understanding punctuation, grammar, and spelling. It allows people with sight loss to have the same access to the written word as sighted people, enabling them to enjoy reading books, signs, and even games. Braille literacy is essential for visually impaired individuals to achieve educational and professional success.
- Braille Today: Braille is recognized as an official script in many countries and is used all over the world. Technology continues to enhance Braille, making it more accessible, and more schools are teaching Braille to ensure new generations can read it.
Design Challenge
Read the full design challenge and discuss the criteria and constraints.
-
Prepare your Image
Draw a bold, high-contrast image (black on white) or use a printed black-and-white image to cut into strips. These strips will be pulled across the micro:bit’s light sensor to trigger different musical tones based on light intensity.
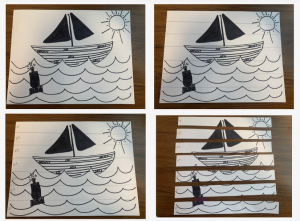
- Choose a High-Contrast Image & Print OR Draw Your Image: Select a black-and-white image with strong contrast — like a silhouette, abstract art, or a line drawing. The more variation in light and dark areas, the more interesting the sound output will be. Alternatively, draw your own high-contrast image on white paper using a black Sharpie.
- Cut Strips: Cut vertical or horizontal strips from the entire image (top to bottom or left to right). Make sure it’s sized to fit over the micro:bit’s LED grid. Number them so you can “read” the image in the correct order.
-
micro:bit Pre-Activity using Microsoft MakeCode
- Write a program that shows the light level on the screen.
- Shine a flashlight on the micro:bit — watch the number go up!
- Cover it with your hand — the number goes down!
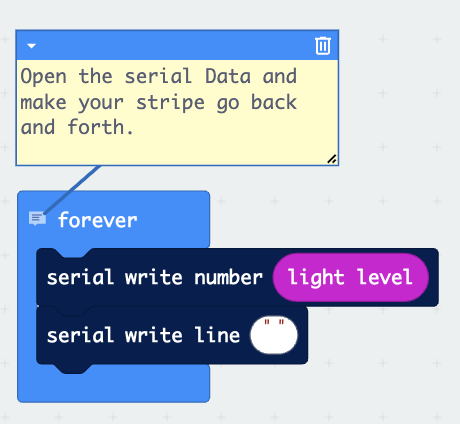
- Open the serial monitor to view the data.
- Observe how the light level changes in real time.
-
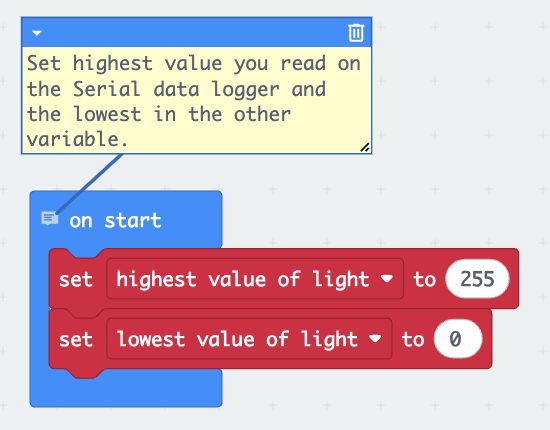
Program the micro:bit using Microsoft MakeCode (see sample code here)
- Use sample code to program the micro:bit
- Connect your micro:bit to your computer and open the Serial Monitor to view light levels
- Shine light or cover the sensor to hear pitch changes
-
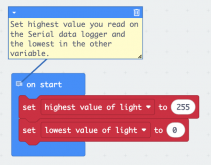
- Initialize Variables
-
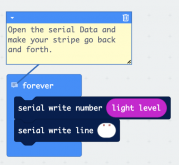
- Log Light Level to Serial Monitor
-
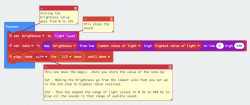
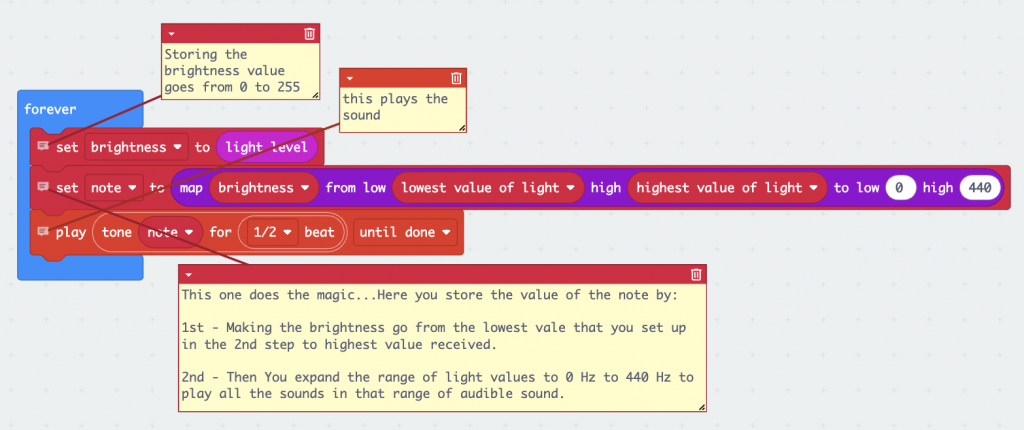
- Map Light Level to Sound Frequency
-
Build the Light-Sensitive Musical Synthesizer Housing
- Create Box/Stand: Using cardboard (or card stock), create a box or stand that can securely hold your micro:bit flat.
- Mount Light: Design a way to mount a mini flashlight (head lamp or cell phone) directly above the micro:bit, pointing down. This ensures consistent lighting as the strip moves across the sensor.
- Create Slit to Pull Strips: Create a slit/opening in the box/stand that allows you to pull the image strips across the micro:bit’s LED grid.
- Mount the micro:bit: Place the micro:bit flat inside your prepared box or on the surface of your stand, ensuring the LED grid faces upwards towards where the image strip will pass.
- Add a Light Source: Mount the flashlight directly above the micro:bit, pointing down, to ensure consistent lighting.
-
Test the Light-Sensitive Musical Synthesizer
- Pull the Strips Across: Slowly pull your image strip #1 across the micro:bit’s LED grid, observing how the light and dark areas passing over the sensor trigger different musical tones. Continue to pull all the strips in the correct order to “read the image.”

- Listen to the Sound Changes: The micro:bit will map the light levels to musical notes. Darker areas will produce lower tones, and lighter areas will produce higher tones — creating a unique sound pattern based on your image.
- Experiment: Try different images, patterns, or even draw your own with black markers. You can also reverse the strip or change the speed of movement to alter the sound.
- Pull the Strips Across: Slowly pull your image strip #1 across the micro:bit’s LED grid, observing how the light and dark areas passing over the sensor trigger different musical tones. Continue to pull all the strips in the correct order to “read the image.”
-
MATLAB Activity
- If you haven’t already – create a MathWorks account.
- Visit: MATLAB Activity Page and click ‘Open in MATLAB Online’
- Students will follow the step-by-step instructions in the file ‘BrightBeatsChallenge_Student.mlx’. Preview the activity here.
- The MATLAB Online (basic) platform opens directly in a browser window, allowing you to seamlessly engage in the activity. This platform is free to use for up to 20 hours/month.
- PDF of Instructor Guide
Why MATLAB? In MATLAB, students will learn how computers “see” images by working with grayscale and color pictures that the micro:bit is unable to read. The light sensors in the micro:bit are intended to detect big changes in ambient light, and cannot detect small differences or specific colors. MATLAB represents digital images as a matrix of pixels with corresponding brightness values (for black and white or grayscale images) or RGB color codes (for color images). Whereas the micro:bit provides a single number to show how bright the surrounding environment is, MATLAB can represent thousands of single pixels simultaneously.
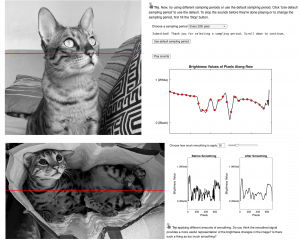
Both systems use numbers to describe light, but in different ways. Together, they show how different digital tools can sense and respond to the world using light.MATLAB additionally has built-in signal processing tools that allow students to to easily apply critical signal processing techniques, such as smoothing and choosing a sampling period. Because MATLAB is an industry standard tool in the field of signal processing, this activity provides students with a more authentic experience of manipulating and interpreting signals. Finally, students have the option to explore and customize every part of MATLAB code without being limited to what’s possible with micro:bit.
-
Engineering Design Process
Background Concepts
Signal Processing
Have you ever taken a photo or recorded a sound on your phone? That’s signal processing in action! A signal is just a way to carry information, like light from a sunset or sound from your voice. These signals come from the world around us, and they usually travel in waves.

Light and sound are both types of waves. Light waves move super fast (about 300 million meters per second) and help us see colors, shapes, and brightness. Sound waves travel much slower through the air (around 340 meters per second) and let us hear music, speech, and noise. Each wave has a frequency, which means how fast it oscillates or vibrates. High frequency means fast vibrations (like a whistle) and low frequency means slow vibrations (like a drumbeat). The velocity of a wave is how fast it travels through a material, and it depends on the type of wave and what it’s moving through. Light has a much higher velocity than sound, which is why we see lightning before we hear thunder!
- Wavelength is the distance between two matching points on a wave, like crest to crest. Short wavelengths are close together, and long wavelengths are spread out.
- Amplitude is how tall the wave is from the middle line to the crest or trough. Bigger amplitude means more energy, like louder sounds or brighter light. Smaller amplitude means softer or dimmer signals.
- Propagation is the direction the wave travels. Even though the wave moves up and down, the energy moves forward, like a stadium wave passing through the crowd.
When we use a sensor, like the light intensity sensor on a micro:bit or a microphone, we’re turning those waves into numbers that a computer can understand. That’s called transforming the signal. The computer then uses those numbers to create images, play sounds, or even control robots. So
every time you snap a selfie or play a song, you’re using signal processing to turn waves into numbers that our digital devices can understand.
Image Processing
Image processing is a type of signal processing. It’s how computers and devices understand, improve, and transform pictures. Just like sound is a wave that carries information to our ears, light is a wave that carries visual information to our eyes (and to cameras!). When you snap a photo, your phone captures light waves bouncing off objects and turns them into digital signals, patterns of numbers that represent colors, brightness, and shapes.
Once the image is captured, it can be digitally transformed using image processing techniques. This can include:
- Sharpening a blurry photo so edges look clearer
- Smoothing a photo to make it blurry
- Adjusting brightness or contrast to make details pop
- Removing noise (such as graininess) to make the subject of the image more clear
- Detecting edges to find outlines of objects
- Recognizing faces or objects using AI
- Compressing the image to make it smaller for storage or sharing
Real-World Examples of Image Processing
- Photo Filters: When you add a filter on Instagram or Snapchat, image processing changes the color

- Medical Imaging: MRI and X-ray machines use image processing to highlight tissues, detect tumors, and help doctors make diagnoses.
- Self-Driving Cars: Cameras on autonomous vehicles use image processing to detect lanes, signs, pedestrians, and other cars.
- Satellite Images: Scientists use image processing to study weather patterns, track wildfires, or monitor forests from space.
- Microscope Analysis: In biology labs, image processing helps researchers count cells, measure growth, or detect tiny structures.
When a camera or a computer represents an image, it samples the light waves and turns them into a grid of pixels. Each pixel contains information about the light’s intensity (brightness) and frequency (color) at any given point on an image. The computer then processes this data (by cleaning it up, enhancing it, or analyzing it) all based on mathematical rules and algorithms.
More Signal Processing Resources:
- Visit: TryEngineering Signal Processing Collection
- Watch: TryEngineering Signal Processing Video
- Explore: TryEngineering Wave Wonders: A Signal Processing Journey Ebook
- Learn More: Free MATLAB tutorial on Signal Processing
Vocabulary
- Amplitude: How tall the wave is from the middle line to the crest or trough. Bigger amplitude means more energy, like louder sounds or brighter light. Smaller amplitude means softer or dimmer signals.
- Frequency (Hz): How fast something vibrates each second. Higher frequency means higher pitch (like a whistle); lower frequency means lower pitch (like a drum). For images, different frequencies correspond to different colors.
- Image Processing: How computers transform signals in an image to, for example, make the image clearer or smaller, or transform the image by adding filters, finding faces, or removing blur.
- Intensity: How bright a light is shining as measured by a light sensor or represented numerically by computer programs.
- LED (Light-Emitting Diode): An LED is a small light that converts electricity into light. It’s super efficient, doesn’t get hot like old bulbs, and comes in lots of colors. LEDs are used in things like flashlights, screens, and even the micro:bit’s 5×5 grid.
- Light Sensor: A small tool that measures how bright the light is. Found in phones, cameras, and automatic lights.
- Light Wave: A wave made of light energy that moves super fast and helps us see colors, shapes, and brightness.
- MATLAB: MATLAB is a programming platform with the power to perform complex calculations. It’s used by millions of engineers and scientists to analyze data, develop algorithms, and create models.
- Pixel: A pixel is a tiny dot that makes up a picture on a screen. When you look at a photo or a game on a computer, tablet, or TV, the picture is made of thousands (or even millions!) of these little dots. Each pixel can be a different color and have different light intensity, and when they all work together, they create the image you see.
- Phototransistor: A tiny electronic part that reacts to light. When light shines on it, the phototransistor lets more electricity flow through a circuit. The brighter the light, the more electricity it allows. It’s like a light-sensitive switch that helps devices measure how much light is around. Phototransistors are used in devices such as remote controls and in the micro:bit’s 5×5 grid.
- Propagation: The direction the wave travels. Even though the wave moves up and down, the energy moves forward, like a stadium wave passing through the crowd.
- Sampling Period: When scientists and engineers analyze signals, it’s important to choose the right sampling period. Sampling is like taking snapshots of the signal. If the sampling period is small, we take snapshots of the signal very often. If the sampling period is large, we wait longer between snapshots. Choosing the right sampling period can be tricky: a shorter period (lots of snapshots) is great for accuracy and detail, but can take up a lot of space on the computer while a longer period (fewer snapshots) can save space and power, but might miss out on details.
- Signal Processing: How machines or computers clean up, change, or understand signals like sound, light, or movement.
- Smoothing: A common step when scientists and engineers are trying to understand different signals (like brightness or sound signals). It helps to make patterns clearer, reduce noise, and make signals easier to analyze. Think of it like brushing messy hair. The hair is still there, but now it’s neat and easier to see the shape!
- Sound Wave: A wave made of vibrating air that travels to our ears so we can hear music, voices, and noises.
- Synthesizer: An electronic device or app that creates sound by changing wave patterns. Used in music to make beats and effects.
- Velocity: The velocity of a wave is how fast it travels through a material
- Wave: A repeating pattern that moves energy from one place to another. Waves can carry sound, light, or motion.
- Wavelength: The distance between two matching points on a wave, like crest to crest. Short wavelengths are close together (like a whistle), and long wavelengths are spread out (like a drumbeat).
Dig Deeper
Light Sensors & micro:Bit
Light sensors, like the one built into the micro:bit, detect the intensity of ambient light using a component called a phototransistor. A phototransistor is a light-sensitive semiconductor that changes its electrical resistance based on how much light it receives. In the micro:bit, the LED display doubles as a light sensor by measuring how much light is reflected back into the LEDs. This allows the device to quantify brightness on a scale from 0 (dark) to 255 (very bright), enabling it to respond to environmental lighting conditions.
Can LEDs See Light?
It sounds strange, but yes — the same little lights (LEDs) on the micro:bit that shine can also help sense light! The micro:bit doesn’t have a separate light sensor. Instead, it cleverly uses the LED display to measure how bright the room is.
How It Works
The micro:bit has 25 tiny LED lights arranged in a 5×5 grid, and they’re not just for glowing, they can also sense light. When you ask the micro:bit to check the light level, it briefly turns off the LEDs and measures how much light is bouncing back. Based on what it detects, it gives you a number between 0 and 255, where 0 means super dark and 255 means very bright. This clever trick lets the micro:bit “see” changes in light and respond to its surroundings.
What’s Happening Inside?
The micro:bit uses a special part called a phototransistor, a tiny sensor that reacts to light. When light shines on the LED grid, the phototransistor helps the micro:bit measure how much the electrical current changes in the circuit. The brighter the light, the bigger the change, which means the micro:bit gives a higher number to show how much light it sees.
This is useful because it lets you use light to control games, music, or animations in creative ways. With the right setup, you can build projects that respond to sunlight, flashlights, or even shadows, turning everyday light into a powerful tool for interaction. It’s like giving your micro:bit a pair of eyes, helping it sense and react to the world around it just like we do.
micro:bit Resources
Student Worksheet
Student Worksheet Name:______________________________
The Challenge
In the Bright Beats Design Challenge, you will create a light-sensitive musical synthesizer using a micro:bit to transform light levels into corresponding musical notes. This project demonstrates a key concept in signal processing: translating a visual signal (light from an image) into an audio signal (sound). Use this worksheet to guide through the design challenge. After you complete the design challenge, you will move on to the accompanying MATLAB activity to turn pixels from digital images into piano notes.
Your final design must meet the following requirements:
Criteria
- Light Detection: Use the micro:bit’s light sensor to measure ambient brightness.
- Sound Mapping: Program musical notes that correspond to specific light levels.
Constraints
- You must use only onboard micro:bit components (no external sensors or speakers).
- The system must operate continuously without manual resets.
Materials Checklist
- Computer (1 per team)
- 1 micro:bit v2 (per team)
- Printed black and white image OR white paper and black marker
- Mini flashlight, head lamp, or cell phone light
- Cardboard or Cardstock
- Tape/Glue, Rubber Bands, Scissors
Steps & Instructions
Step 1: Prepare Your Image
Draw a bold, high-contrast image (black on white) or use a printed black-and-white image to cut into strips. The strips will be pulled across the micro:bit’s light sensor to trigger different musical tones based on light intensity.
- Choose a Black-and-White Image & Print OR Draw Your Image
- Cut Strips (vertical or horizontal) & Number them
- Make sure it’s sized to fit over the micro:bit’s LED grid. Number them so you can “read” the image in the correct order.
Step 2: Micro:bit Pre-Activity Programming
To prepare you for the design challenge with micro:bit, try this Pre-Activity:
- Write a program that shows the light level on the screen.
- Shine a flashlight on the micro:bit — watch the number go up!
- Cover it with your hand — the number goes down!
- Open the serial monitor to view the data.
- Observe how the light level changes in real time.
Program the micro:bit to solve the design challenge:
- Initialize Variables
- Log Light Level to Serial Monitor
- Map Light Level to Sound Frequency
- Play the Sound
Step 3: Build the Housing
Sketch different design ideas Step 4: Test and Troubleshoot
Step 5: MATLAB Simulation
- If you haven’t already, create a MathWorks account.
- Visit the MATLAB Activity Page and click ‘Open in MATLAB Online’
- Follow the step-by-step instructions in ‘BrightBeatsChallenge_Student.mlx’
Part 1: Translate stripes to sounds
- Your micro:bit device ‘translated’ a black and white image into sounds. You can do the same thing in MATLAB!
- Try: Generate a few random striped images, and make note of how the brightness value plots change corresponding to the stripe patterns.
- Challenge: Close your eyes and listen to the sounds again. Can you visualize the striped image just by listening to the sounds?
- How many stripes are there in total?
- How many black stripes are there? How many white?
- Can you tell which stripes are wide and which are thin?
- Challenge: Grab a blank strip of paper and draw the striped image we generated with MATLAB. Copy it as closely as you can. Pull this image strip across the micro:bit device you built earlier. What are some differences you notice between how the micro:bit translates the stripes into sounds compared to MATLAB?
Part 2: Translate a grayscale image to sounds
- The micro:bit device you built earlier can only read black and white images. But MATLAB is more sensitive than the micro:bit, and can ‘read’ the image in more detail.
- For this activity, you can either upload a picture or load an example image or take a picture with your webcam
- Reflect:Try to match the brightness values to the image row you selected. Does the plot make sense? How well do the brightness values track the dark and bright pixels along the image row?
- Smoothing is a common step when scientists and engineers are trying to understand different signals (like brightness or sound signals). It helps to make patterns clearer, reduce noise, and make signals easier to analyze.
- Try: Apply different amounts of smoothing to the brightness signal. Do you think the smoothed signal provides a more useful representation of the brightness changes in the image? Is there such a thing as too much smoothing?
- Sampling period: When scientists and engineers analyze signals, it’s important to choose the right sampling period. Sampling is like taking snapshots of the signal. If the sampling period is small, we take snapshots of the signal very often. If the sampling period is large, we wait longer between snapshots. Choosing the right sampling period can be tricky: a shorter period (lots of snapshots) is great for detail, but can take up a lot of space while a longer period (fewer snapshots) can save space, but miss out on details.
- Try: If we played every single pixel as a sound lasting half a second, how long would it take to play every pixel in the row? Check your answer in MATLAB!
- Reflect: Is there an ‘ideal’ sampling period that saves time while still accurately representing the changing brightness values in the image?
- Challenge: Close your eyes and listen to the sounds again. Can you visualize the changes in brightness in the image? How does choosing different sampling periods affect how you visualize the brightness changes in the image?
Part 3: Translate colors to sounds
- The micro:bit light sensor can’t detect different colors. But MATLAB can ‘read’ the colors of pixels in an image. Instead of translating pixel brightness into sounds, let’s translate pixel colors into sounds.
- Try: Generate several colored stripe images and play the sounds. Practice memorizing which sound represents each color.
- Challenge: Close your eyes and listen to the sounds again. Can you visualize the colors of each stripe?
- Pair up and have your partner generate a new colored stripe image and play the sounds. Guess what color each stripe is based on the sounds. Have your partner check your answers. Compete to see who can get the most correct.
- Challenge: Grab a blank strip of paper and colored markers or pencils. Draw the colored striped image generated with MATLAB. Copy it as closely as you can. Pull the strip across the micro:bit device you built earlier. Can the micro:bit light sensor detect the different colors and play different sounds for each color?
- Close your eyes and listen to the sounds as you pull the strip through your micro:bit device. Can you guess the color of the stripes based on the sounds?
Make Connections & Reflect on Challenge
Answer the following questions to reflect on what you learned from the Bright Beats Challenge, after you’ve completed both the design challenge and the accompanying MATLAB activity.
Signal Processing Connection
- How did the process of converting light levels to musical notes demonstrate signal processing?
- In what ways did the “reading” of the black-and-white image relate to how computers process images?
- What challenges did you encounter in translating a visual signal (light from the image) into an audio signal (musical notes)?
- How might understanding signal processing and image processing be useful in other real-world applications?
- If you were to enhance the “Bright Beats Challenge,” what aspects of signal processing or image processing would you try to incorporate or improve?
Reflection
- What was the most challenging part of building your light-sensitive musical synthesizer?
- How did the micro:bit translate light levels into musical notes?
- What did you learn about how computers “see” and interpret images?
- In what ways do computers and programs like MATLAB represent images differently from the micro:bit device?
- What are key differences between how the micro:bit device functions and how MATLAB represents and transforms images?
- How might this project help visually impaired individuals interact with images in new ways?
- If you were to do this challenge again, what would you do differently?
Curriculum Alignment
- USA (NGSS)
Engineering Design (MS-ETS1)
Defining problems, developing solutions, testing prototypes - UK (KS3 Computing)
Programming & Physical Systems
Use of sensors, variables, and control structures
- Australia (ACARA)
Digital Technologies
Design and implement digital solutions using microcontrollers
- USA (NGSS)
Related Engineering Fields and Degrees
Lesson In Action
-

- TX, United States
-
- TX, United States
-
- TX, United States
-

- NJ, United States
-
- MA, United States
-
- MA, United States
-

- Uruguay
-

- Uruguay
-

- Uruguay
-