Get Connected With Ohm's Law
This lesson plan demonstrates Ohm’s Law (E = I x R). Students use digital multimeters to collect data that are plotted to show that voltage and current are related by linear functions for ordinary resistors and by power functions for light bulbs.
- Learn about Ohm’s Law.
- Be able to use a digital multimeter to collect data.
- Explore the concepts of voltage and current.
This lesson was contributed by IEEE Member, Ralph D. Painter, IEEE Florida West Coast Section
Age Levels: 10-18
Build Materials (For 30 workstations)
Required Materials
- 30 – Battery holder, 4 AA batteries
- 1 – Battery holder, one AA cell
- 120 – AA batteries
- 30 – Screw-based lamp holder
- 100 – Jumper leads
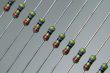
- 30 – Resistor, 1/2 watt, 47 ohm
- 30 – Resistor, 1/2 watt, 100 ohm
- 30 – Light bulb, no 40, 6.3 V, 150 mA
- 1 – Roll of Wire, 22, 20 or 18 AWG, stranded, any color
- 60 – Digital multimeter
- 1- Solder, 60-40, rosin core
- 3 – Mending plates, brass, 1/2 x 2 inches
- 60 – Mending plates, brass, 1/2 x 2 inches
- 5 – Pieces Wood, 1″ x 6″ x 8” (cut size 3/4″ x 5 1/2″)
- 100 – No 4 flat head wood screws-1/2″ long
- 100 – No 4 flat head wood screws-3/4″ long
- 5 – Sheets sandpaper, fine, 120 grit.
Possible Sources for Required Materials
- Local hardware store
- Omnitron Electronics (www.omnitronelectronics.net)
- Radio Shack (www.radioshack.com)
Continuity Tester Assembly Instructions
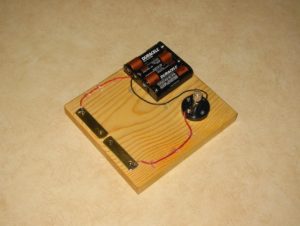
The parts for the continuity tester pictured below are mounted on wooden board that is 6 inches long and which is cut from nominal 1 inch by 6 inch lumber (actual size 3/4 inch x 5 1/2 inches). The dimensions of the board and the exact placement of the components are not critical. The battery holder is fastened to the board with two number four flat head wood screws, 1/2 inch long. The lamp holder is fastened to the board with two number four flat head wood screws 3/4 inch long. The 20 AWG stranded wires are secured to the board with dabs of glue from a hot glue gun. The brass plates are 1/2 inch x 2 inch solid brass “mending plates” that are available from home centers, hardware stores and cabinet shops. The wires are soldered to the brass plates with 60-40 rosin core solder.
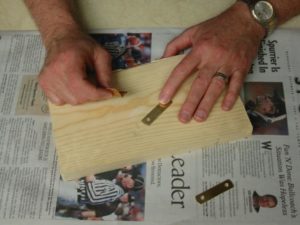
The brass plates are covered with a lacquer finish to prevent tarnish. However, this coating is non-conducting and therefore must be completely removed from the brass plates. Also the lacquer must be removed to facilitate making the solder connections. Fine sandpaper (120 grit) does a good job of removing the lacquer finish.
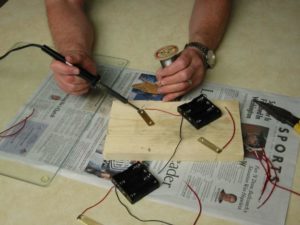
Solder joints can be made with a small, 25-watt soldering iron. The wire connections to the brass plates are made before mounting the brass plates and the battery holder on the board.
The parts before mounting are shown here.


Alternate Single Cell Battery Holder Photos and Diagrams
Testing the Resistors
Measuring and recording data for each of the resistors is essentially the same as for the light bulb. The exact details for connecting the resistor in the circuit are shown in the Continuity Tester Assembly section of the “Materials” Section.
However, be sure to remove the light bulb from the lamp holder so that none of the current bypasses the resistor and overloads the milliamp meter. Failure to remove the light bulb from the lamp holder with the resistor also in the circuit may cause the fuse in the milliamp meter to blow.
Once the first data point for the resistor is measured and recorded, proceed to remove and bypass one cell at a time to obtain the second, third and fourth data points for the resistor. The procedure for removing and bypassing cells is the same as was used for the light bulb and is shown in figures 2A, 2B and 2C in the student worksheet. The fifth data point for zero milliamps and zero volts is assumed for the resistors just as it was for the light bulb. The data for both the resistors and the light bulb can be recorded on the same datasheet and graph for easy comparison of the curves for each element.
Design Challenge
You are a team of engineers given the challenge of using digital multimeters to collect data that are plotted on a graph to show that voltage and current are related by linear functions for ordinary resistors and by power functions for light bulbs. You’ll draw a “best” fit curve through the data points for the element tested, repeat the process for two or three different circuit elements, and compare the curves.
Criteria
- Must use a multimeter to collect data.
- Must plot points on the graph that represent the voltages and currents recorded.
- Draw a “best fit” curve through the data points for the element tested.
- Repeat the process for two or three different circuit elements.
- Compare the curves and make observations about the nature of the curves for each element.
Constraints
- Use only the materials provided.
- This activity is completed in teams of 2.
- Hand out the Get Connected with Ohm’s Law worksheet.
- Discuss the topics in the Background Concepts Section. Discuss Ohm’s Law.
What is Ohm’s Law?
Ohm’s Law is a mathematical equation explaining the relationship between Voltage, Current, and Resistance within electrical circuits. It is defined as: E = I x R- E = Voltage (Voltage is an electric potential difference between two points on a conducting wire. Voltage is measured in volts and comes from various sources such as electric outlets and batteries.)
- I = Current (Current is measured in amps. Current is charged particles which flow from the voltage source through conductive material to a ground.
- R = Resistance (Resistance is the opposition that a material body offers to the passage of an electric current. Resistance is measured in ohms. Examples of items with resistance are light bulbs and coffeemakers.)
- The activity consists of using a nominal six volt battery (made up of four nominal 1.5 volt dry cells connected in series) to:
- Drive current through a simple circuit element and measure and record the current through the element and the voltage across the element as the number of cells in the battery is varied from a single cell to four cells.
- Plot points on the graph that represent the voltages and currents recorded.
- Draw a “best fit” curve through the data points for the element tested.
- Repeat the process for two or three different circuit elements.
- Compare the curves and make observations about the nature of the curves for each element.
- Equipment
- Three circuit elements that work well are a 47-ohm resistor, a 100-ohm resistor and a number 40 flashlight bulb (rated 6.3 volts, 150 mA). The equipment illustrated here makes use of a continuity tester that consists of a four-cell AA battery holder connected in series with a miniature screw shell lamp holder. The open wire from the battery holder and the open wire from the lamp holder are terminated on two small, flat, brass, mending plates. Objects to be tested for continuity are used to bridge the narrow gap between the brass mending plates. Complete instructions explaining how to assemble the continuity tester are given in the “Materials” Section.
- However, the activity works just as well using C or D cells in either four-cell battery holders or in single cell battery holders that are connected in series as required. Schematic diagrams and photographs of the alternate arrangement using individual battery holders are given in the “Materials” Section.
- Although the activity can be done with a single meter, it is best accomplished if two multimeters are available for each workstation. One multimeter is set on the 200 milliamp scale to measure the current through the circuit element under test and a second multimeter is set on the 20 volt scale to measure the voltage dropped across the circuit element under test. Almost any model of digital or analog multimeter can be used. Also, three or four short alligator clip test leads or “jumpers” are needed to make all the interconnections. Complete details about the equipment and estimated costs are provided in the “Materials” Section.
- Collect the data and plot the curvesFollow the step-by-step instructions given in the student worksheet to collect the data and plot the E-I curves for the light bulb and one or two fixed resistors. A picture of the graph and data sheet with typical student data for the light bulb and resistors is shown here.

Fig. 4 Once students have successfully captured the data and have plotted the curves on the graphs, they can begin to make observations about the relationship between the voltages across the resistors and the currents through the resistors. Have students work through the discovery activities in the following sections. Depending on your students, the discovery activities can be done either individually or as a group or class exercise. The values used as examples in the discovery activity below are taken from the typical student data shown in the image above.
Discovering Ohm’s Law Example
- Draw a horizontal line on your graph at E = 5 Volts and drop vertical lines down from the intersections of the horizontal line and the curves for the 100 ohm and 47 ohm resistors as shown in the picture below.
Record the values, in milliamps, of I100 and I 47 on the blanks below, then convert these values to amps by multiplying by 1amp / 1000 milliamps.
I100 = 52 mA x (1 amp / 1000 mA ) = .052 amps.
I47 = 108 mA x (1 amp / 1000 mA ) = .108 amps.
- Using the values in amps of I100 and I47, calculate the resistances R100 and R47.
R100 = 5 V / I100 = 5 V / .052 A = 96 ohms.
R47 = 5 V / I47 = 5 V / .108 A = 46 ohms.
- How do the values for R100 and R47 computed in question 3 above compare with the nominal 100 and 47 ohm values for the resistors?

- Evidently, the resistance of a fixed resistor is the slope of the line that defines the relationship between voltage and current. Another way of stating this is to observe that the voltage across the resistor is proportional to the current that is passing through the resistor. Resistance is just the constant of proportionality between voltage and current.
- Writing E-I equations for the fixed resistors.
The equations of the line on the E-I graphs can be written by substituting the values for R100 and R47 derived from the data above.
For the 100 ohm resistor
E = R100 I = ( 96 ohms) I
And for the 47 ohm resistor
E = R47 I = ( 46 ohms) I
Plug a value of 0.050 amps (50 milliamps) into the equations above and calculate the resulting voltages for the 100-ohm and the 47-ohm resistors.
For the 100 ohm resistor
E = R100 0.050 amps = 96 ohms x 0.050 A = 4.8 volts.
Similarly, for the 47 ohm resistor
E = R47 0.050 amps = 46 ohms x 0.050 A = 2.3 volts.
Plot these two points on your graphs to confirm that the points lie on or very near the lines for the 100-ohm resistor and the 47-ohm resistor.
Ordered pairs to plot:
100-ohm resistor data point: 50 mA, 4.8 V
47-ohm resistor data point: 50 mA, 2.3 V
- Writing an E-I equation for the light bulb.
Consider now the case of the light bulb. Since the E-I curve for the light bulb is not a straight line, how is resistance defined for the light bulb? As a matter of fact, the resistance for the light bulb is defined as the ratio of the voltage to the current just as in the case of the fixed resistors. However the following activity will demonstrate that the resistance is no longer a fixed value.
- The E-I curve for the light bulb is shown in the sketch below. Draw two horizontal lines at E = 5 V and at E = 2 V that intersect the curve and drop two vertical lines down from the points of intersection and read the values of I2V and I5V on the milliamp scale.
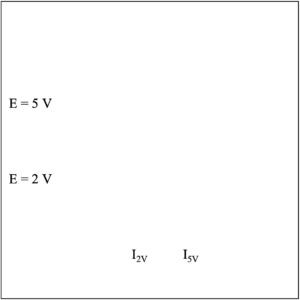
Record the values, in milliamps, of I2V and I5V on the blanks below, then convert these values to amps by multiplying by 1amp/ 1000 milliamps.
I2V = 83 mA x (1 amp / 1000 mA ) = .083 amps.
I5V = 136 mA x (1 amp / 1000 mA ) = .136 amps.
Using the values in amps of I2V and I5V, calculate the resistances R2V and R5V.
R2V = 2 V / I2V = 2 V / .083 A = 24 ohms.
R5V = 5 V / I5V = 5 V / .136A = 37 ohms.
- Clearly the values for R2V and R5V are significantly different, which comes as no surprise since the E-I curve for the light bulb is not a straight line. The process of writing an equation that expresses the relationship between voltage and current for the light bulb is more involved than just recognizing that the resistance is the slope of the E-I curve as in the case of the fixed resistors. A parabolic equation of the form E = k I2 can be derived using any one of the data points. However, the curve will generally pass through the origin and the point that was used to derive the value of k, but other data points may lie a significant distance off the curve. More sophisticated polynomial equations can be derived which pass through all the data points; however the mathematics involved is beyond the scope of this activity.
- In this example, the point 124 mA, 4.36 V will be used to compute a value for k:
k = E / I2 = 4.36 V / (124 mA)2 = 0.000284 volts/(mA)2
- Therefore, the relationship between voltage and current for the light bulb can be approximated by the equation below where E is in volts, I is in milliamps and k has the units volts/(milliamps)2.
E = k I2 = 0.000284 volts/(mA)2 I2
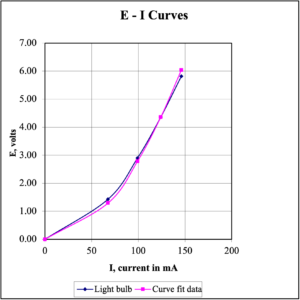
- The actual data for the light bulb and the curve fit data are plotted on a common graph on the next page for comparison. As an example, the first point is calculated below.
I = 67.5 mA, therefore, E = [.000284 volts/(mA)2](67.5 mA)2 = 1.29 V
I, mA 0.0 67.5 99.1 124 146
E = k I2 0.0 1.29 2.78 4.36 6.04
- Making the mathematical connectionMost middle and high school students will immediately recognize that the equation y = m x + b is the equation of a line in the x-y plane and that “m” is the slope of the line and that the line passes through the point “b” on the y-axis. Moreover, most students will also recognize that the equation y = m x is a special case in which the line passes through the origin of the x y plane. However, it seems very difficult in most cases for students to recognize that Ohm’s Law, which is usually written “E = I R,” is also the equation of a straight line through the origin of a plane where “E” is plotted on the vertical axis and “I” is plotted on the horizontal axis. This exercise is designed to help students make the connection between the abstract concepts learned in algebra 1 and the physical quantities of electromotive force (voltage) and electrical current.For a fixed resistor, Ohm’s law is the simple expression of the proportional relationship between the electromotive force in volts and the current in amperes. Usually Ohm’s Law is written for direct current circuits in the following form.E = IR Ohm’s LawWhere “E” is the electromotive force expressed in volts, “I” is the electrical current in amperes and R is the resistance in ohms.For the case of an ordinary fixed resistor, “R” is a constant that expresses the proportionality between the variables “E” and “I.”If E = y, I = x and b = 0 it is readily seen that the equation is of the form y = m x + b and that R is the slope of the line plotted on the E – I plane.Writing Ohm’s law with subscripts and rearranging the order of R and I emphasizes the correspondence between E, R, and I with y, m and x in the point slope form of a linear equation.Ey = Rm Ix
- Graphing CalculatorsThe voltage and current data for the resistors and for the light bulb can be entered into a graphing calculator, such as the TI-83, to derive a best-fit linear or quadratic equation. Using graphing calculators to analyze physical data is another good way of demonstrating to students the connection between abstract mathematical concepts and the “real world.”
- See the continuity tester assembly instructions under the “Materials” Section.
- Testing the ResistorsMeasuring and recording data for each of the resistors is essentially the same as for the light bulb. The exact details for connecting the resistor in the circuit are shown here.
 However, be sure to remove the light bulb from the lamp holder so that none of the current bypasses the resistor and overloads the milliamp meter. Failure to remove the light bulb from the lamp holder with the resistor also in the circuit may cause the fuse in the milliamp meter to blow.Once the first data point for the resistor is measured and recorded, proceed to remove and bypass one cell at a time to obtain the second, third and fourth data points for the resistor. The procedure for removing and bypassing cells is the same as was used for the light bulb and is shown in figures 2A, 2B and 2C above. The fifth data point for zero milliamps and zero volts is assumed for the resistors just as it was for the light bulb. The data for both the resistors and the light bulb can be recorded on the same datasheet and graph for easy comparison of the curves for each element.
 - For more content on the topic, see the “Digging Deeper” section.Optional Insulators and Conductors ActivityThe insulators and conductors activity is a good lead into the Ohm’s Law activity or for a discussion of the nature of conductors and insulators and semiconductors. The conductivity board is a very useful classroom tool for a wide range of ages from elementary grades to high school.Students are given a collection of materials and are asked to sort them into piles of conductors and non-conductors. For the initial sort, conductors are any material that causes the light to burn, however dimly, and non-conductors are materials for which no indication of light can be seen.
 Suggested materials:
- Non-conductors: Paper, wood craft stick (Popsicle stick), rubber band, plastic drinking straw, and string or twine.
- Conductors: Rectifier diode (e.g. 3A, 50 V Radio Shack 276-1141), 1/2 watt, 47 ohm resistor, 1/2 watt, 100 ohm resistor, pencil lead, aluminum foil, pennies, steel nail, copper wire.
Once the initial sort is made, students are asked to further sort the conducting materials into two groups: group 1 including those materials for which the light bulb burns very brightly and group 2 including those materials for which the light bulb is noticeably dimmer. The group 1 materials will include the materials that are made of the common metals such as aluminum, copper and iron.
The group 2 materials, those that conduct electricity well enough to light the bulb to some degree but not as brightly as the metallic conductors, include the 47-ohm resistor, the 100-ohm resistor, the diode and pencil lead.
Have your students compare the brightness of the light bulb when operated in series with the 47-ohm resistor to the brightness of the light bulb when operated with the 100-ohm resistor. Depending on how fresh are the batteries, the light bulb filament may just barely glow when operated on the 100-ohm resistor.
The diode is the only material that conducts in one direction, but not the other. A discussion of how the diode works is a good introduction to a discussion of semiconductors.
Pencil lead is another very interesting material. It is important to make clear to students that pencil lead does not contain any metallic lead, but rather is a form of carbon called “graphite.” The fact that diamonds are also made entirely of carbon atoms, but are good insulators is a clear demonstration that materials owe their properties of electrical conduction not only to the type of atoms present, but also to the arrangement of the atoms in a particular crystalline structure.
The reason pencil lead is so named is simply because pencil lead resembles metallic lead in appearance. Graphite therefore is a good example of a non-metallic conductor. Graphite is also an excellent lubricant that can also withstand high temperatures. Because graphite is slippery but is not sticky like lubricating oil, graphite is used as a lubricant for locks and for bicycle chains. The combination of lubricating and conducting properties of graphite also make graphite an excellent material to use for sliding electrical contacts. For example, graphite “brushes” are used to transmit electric current to the rotating armatures of electric motors such as those used in automobile starting motors, vacuum cleaners, hand-held electric drills and other appliances.
Time Modification
The lesson can be done in as little as 1 class period for older students. However, to help students from feeling rushed and to ensure student success (especially for younger students), split the lesson into two periods giving students more time to brainstorm, test ideas and finalize their design. Conduct the testing and debrief in the next class period.
Ohm’s Law Information Sheet
What is Ohm’s Law?
Ohm’s Law is a mathematical equation explaining the relationship between Voltage, Current, and Resistance within electrical circuits. It is defined as: E = I x R
- E = Voltage (Voltage is an electric potential difference between two points on a conducting wire. Voltage is measured in volts and comes from various sources such as electric outlets and batteries.)
- I = Current (Current is measured in amps. Current is charged particles which flow from the voltage source through conductive material to a ground.
- R = Resistance (Resistance is the opposition that a material body offers to the passage of an electric current. Resistance is measured in ohms. Examples of items with resistance are light bulbs and coffeemakers.)
The resistor is the simplest of the three passive circuit elements.
There are three passive electrical circuit elements: the capacitor, which stores energy in the form of an electric field; the inductor, which stores energy in the form of a magnetic field and the resistor, which dissipates rather than stores energy. This exercise deals only with the resistor, the simplest of the three passive circuit elements. However two types of resistors are tested, linear resistors that have constant or fixed resistance and the light bulb which has a non-linear resistance that varies with the amount of current passing through the light bulb.
Tradition prevails in notation.
While the use of “R” to represent resistance is intuitive enough, the uses of “E” and “I” to represent the voltage “E” developed across the resistor through which is passing a current “I” derive from tradition. “E” stands for “electromotive force,” the original term for the quantity that tends to push electrical charges through a circuit. Common usage now is to refer to the electromotive force as simply the “voltage,” either of a source such as a battery or of the potential developed across a resistor through which charge is passing. Likewise, in the early days in the development of electrical theory, the amount of charge passing through a circuit in a given period was called the “intensity,” a quantity that is now commonly called the “current” or the “amperage” or sometimes simply the “amps.” For our purposes we will refer to the quantity, “E,” that is driving charge through the resistor as the “voltage” and will refer to the quantity, “I,” the amount of charge passing through the resistor in a given time, as the “current.” Ohm’s law defines the resistance as the ratio of the voltage across the element to the current flowing through the element.
E = I R Ohm’s law
R = E / I Ohm’s law definition of resistance.
Internet Connections
- Ohm’s Law (ohmslaw.com)
Recommended Reading
- Ohm’s Law, Electrical Math and Voltage Drop Calculations by Tom Henry. ISBN: 0945495269
- A Short History of Nearly Everything, by Bill Bryson. Publisher: Broadway. ISBN: 0767908171
Writing Activity
Identify examples of resistors at home. Make a list of all the examples of items with resistance that can be found in a kitchen.
Alignment to Curriculum Frameworks
Note: Lesson plans in this series are aligned to one or more of the following sets of standards:
- S. Science Education Standards (http://www.nap.edu/catalog.php?record_id=4962)
- S. Next Generation Science Standards (http://www.nextgenscience.org/)
- International Technology Education Association’s Standards for Technological Literacy (http://www.iteea.org/TAA/PDFs/xstnd.pdf)
- S. National Council of Teachers of Mathematics’ Principles and Standards for School Mathematics (http://www.nctm.org/standards/content.aspx?id=16909)
- S. Common Core State Standards for Mathematics (http://www.corestandards.org/Math)
- Computer Science Teachers Association K-12 Computer Science Standards (http://csta.acm.org/Curriculum/sub/K12Standards.html)
National Science Education Standards Grades 5-8 (ages 10-14)
CONTENT STANDARD A: Science as Inquiry
As a result of activities, all students should develop
- Abilities necessary to do scientific inquiry
- Understandings about scientific inquiry
CONTENT STANDARD B: Physical Science
As a result of their activities, all students should develop an understanding of
- Transfer of energy
National Science Education Standards Grades 9-12 (ages 15-18)
CONTENT STANDARD A: Science as Inquiry
As a result of activities, all students should develop
- Abilities necessary to do scientific inquiry
- Understandings about scientific inquiry
CONTENT STANDARD B: Physical Science
As a result of their activities, all students should develop understanding of
- Interactions of energy and matter
Next Generation Science Standards Grades 3-5 (Ages 8-11)
Students who demonstrate understanding can:
- 4-PS3-4. Apply scientific ideas to design, test, and refine a device that converts energy from one form to another.
Next Generation Science Standards Grades 6-8 (Ages 11-14)
Motion and Stability: Forces and Interactions
- MS-PS2-3. Ask questions about data to determine the factors that affect the strength of electric and magnetic forces.
Next Generation Science Standards Grades 9-12 (Ages 14-18)
Energy
- HS-PS3-1. Create a computational model to calculate the change in the energy of one component in a system when the change in energy of the other component(s) and energy flows in and out of the system are known.
- HS-PS3-3. Design, build, and refine a device that works within given constraint s to convert one form of energy into another form of energy.*
Principles and Standards for School Mathematics (ages 10 – 14)
Measurement Standards
Apply appropriate techniques, tools, and formulas to determine measurements.
- use common benchmarks to select appropriate methods for estimating measurements.
Principles and Standards for School Mathematics (ages 14 – 18)
Measurement Standards
Understand measurable attributes of objects and the units, systems, and processes of measurement
- make decisions about units and scales that are appropriate for problem situations involving measurement.
Apply appropriate techniques, tools, and formulas to determine measurements.
- analyze precision, accuracy, and approximate error in measurement situations.
- use unit analysis to check measurement computations.
Common Core State Standards for School Mathematics Grades 3-8 (ages 8-14)
Measurement & Data
- Convert like measurement units within a given measurement system.
- Math.Content.5.MD.A.1Convert among different-sized standard measurement units within a given measurement system (e.g., convert 5 cm to 0.05 m), and use these conversions in solving multi-step, real world problems.
Geometry
- Graph points on the coordinate plane to solve real-world and mathematical problems.
- Math.Content.5.G.A.2Represent real world and mathematical problems by graphing points in the first quadrant of the coordinate plane, and interpret coordinate values of points in the context of the situation.
Ratios and Proportional Relationships
- Understand ratio concepts and use ratio reasoning to solve problems.
- Math.Content.6.RP.A.3Use ratio and rate reasoning to solve real-world and mathematical problems, e.g., by reasoning about tables of equivalent ratios, tape diagrams, double number line diagrams, or equations.
- Math.Content.7.RP.A.2c Represent proportional relationships by equations. For example, if total cost t is proportional to the number n of items purchased at a constant price p, the relationship between the total cost and the number of items can be expressed as t = pn.
Common Core State Standards for School Mathematics Grades 3-8 (ages 8-14)
Expressions & Equations
- Apply and extend previous understandings of arithmetic to algebraic expressions.
- Math.Content.6.EE.A.2Write, read, and evaluate expressions in which letters stand for numbers.
- Reason about and solve one-variable equations and inequalities.
- Math.Content.6.EE.B.6Use variables to represent numbers and write expressions when solving a real-world or mathematical problem; understand that a variable can represent an unknown number, or, depending on the purpose at hand, any number in a specified set.
- Math.Content.6.EE.B.7Solve real-world and mathematical problems by writing and solving equations of the form x + p = q and px = q for cases in which p, q and x are all nonnegative rational numbers.
Functions
- Define, evaluate, and compare functions.
- Math.Content.8.F.A.1Understand that a function is a rule that assigns to each input exactly one output. The graph of a function is the set of ordered pairs consisting of an input and the corresponding output.
Common Core State Standards for School Mathematics Grades 9-12 (ages 14-18)
Algebra
- Create equations that describe numbers or relationships
- Math.Content.HSA-CED.A.4Rearrange formulas to highlight a quantity of interest, using the same reasoning as in solving equations. For example, rearrange Ohm’s law V = IR to highlight resistance R.
- Solve equations and inequalities in one variable.
- Math.Content.HSA-REI.B.3Solve linear equations and inequalities in one variable, including equations with coefficients represented by letters.
Standards for Technological Literacy – All Ages
Design
- Standard 10: Students will develop an understanding of the role of troubleshooting, research and development, invention and innovation, and experimentation in problem solving.
The Designed World
Standard 16: Students will develop an understanding of and be able to select and use energy and power technologies.

 Industrial Engineering
 Computer Engineering
Step By Step Procedure
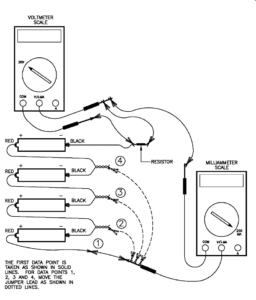
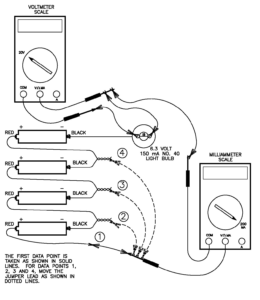
Assuming that the number 40 light bulb is the first circuit element to be tested, arrange the equipment as shown in figure 1 or in the alternate arrangement shown in appendix 2.
It is very important to ensure that the meter that is connected across the lamp holder is set on the 20-volt scale before connecting the meter in the circuit. If the meter that is connected across the lamp holder is set on a current scale, then a short circuit condition is created that will typically blow the fuse in the meter. Likewise, it is important that the meter that is used to measure current be set on a scale of 200 milliamps or higher before connecting the meter in the circuit. Otherwise, the current drawn may blow the fuse in the meter.
Figure 1
Taking the Data
With all four cells in the battery holder, measure and record on the datasheet the voltage and current through the light bulb for the first data point.
Remove and bypass cell number 1 as shown in figure 2A, leaving three cells in the battery holder. Again measure and record on the datasheet the voltage and current through the light bulb to get a second data point.
Now remove and bypass cells number 1 and 2 leaving just two cells in the battery holder as shown in figure 2B leaving just two cells in the battery holder. Again measure and record on the datasheet the voltage and current through the light bulb to get a third data point.
Finally, remove and bypass cells number 1, 2 and 3 leaving just a single cell in the battery holder as show in figure 2C. Again measure and record on the on the datasheet the voltage and current through the light bulb to get a fourth data point.
Since there is obviously no current through the light bulb if no cells are in the battery holder, the point zero current and zero volts can be assumed as a fifth data point.
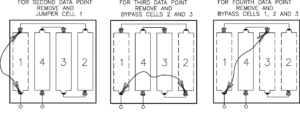 Figure 2A Figure 2B Figure 2C
Plot the Points on the Graph and Draw the Curve
Set up a sheet of graph paper with current in milliamps on the horizontal scale and voltage in volts in the vertical scale as shown on the next page. A convenient horizontal scale is 0 to 175 milliamps and a convenient vertical scale is 0 to 7 volts. Plot the five data points obtained for the light bulb and draw a “best fit” curve though the points.
E in volts vs. I in milliamps.
Data for 6.3 volt, 150 mA, no. 40 light bulb
I, current, mA 0.0 _____ _____ _____ _____ _____
E, emf, volts 0.0 _____ _____ _____ _____ _____
Data for resistor 1 47 Ohms
I, current, mA 0.0 _____ _____ _____ _____ _____
E, emf, volts 0.0 _____ _____ _____ _____ _____
Data for resistor 2 100 Ohms
I, current, mA 0.0 _____ _____ _____ _____ _____
E, emf, volts 0.0 _____ _____ _____ _____ _____
Testing the Resistors
Measuring and recording data for each of the resistors is essentially same as for the light bulb. The exact details for connecting the resistor in the circuit are show in figure 3.
However, be sure to remove the light bulb from the lamp holder so that none of the current bypasses the resistor and overloads the milliamp meter. Failure to remove the light bulb from the lamp holder with the resistor also in the circuit may cause the fuse in the milliamp meter to blow.

Once the first data point for the resistor is measured and recorded, proceed to remove and bypass one cell at a time to obtain the second, third and fourth data points for the resistor. The procedure for removing and bypassing cells is the same as was used for the light bulb and is shown in figures 2A, 2B and 2C above. The fifth data point for zero milliamps and zero volts is assumed for the resistors just as it was for the light bulb. The data for both the resistors and the light bulb can be recorded on the same datasheet and graph for easy comparison of the curves for each element.
Discovering Ohm’s Law
- Draw a horizontal line on your graph at E = 5 Volts and drop vertical lines down from the intersections of the horizontal line and the curves for the 100 ohm and 47 ohm resistors as shown in the picture below.
Record the values, in milliamps, of I100 and I 47 on the blanks below, then convert these values to milliamps by multiplying by 1amp / 1000milliamps.
I100 = ________ mA x (1 amp / 1000 mA ) = __________ amps.
I47 = ________ mA x (1 amp / 1000 mA ) = __________ amps.
- Using the values in amps of I100 and I47, calculate the resistances R100 and R47.
R100 = 5V / I100 = __________ ohms.
R47 = 5V / I47 = __________ohms.
How do the values for R100 and R47 computed in question 3 above compare with the nominal 100 and 47 ohm values for the resistors?
Evidently, the resistance of a fixed resistor is the slope of the line that defines the relationship between voltage and current. Another way of stating this is to observe that the voltage across the resistor is proportional to the current that is passing through the resistor. Resistance is just the constant of proportionality between voltage and current.
- Writing E-I equations for the fixed resistors.
The equations of the line on the E-I graphs can be written by substituting the values for R100 and R47 derived from the data above.
For the 100 Ohm resistor
E = R100 I = ( _______ ohms) I
And for the 47 Ohm resistor
E = R47 I = ( _______ ohms) I
Plug a value of 0.050 amps (50 milliamps) into the equations above and calculate the resulting voltages for the 100-ohm and the 47ohm resistors.
For the 100 Ohm resistor
E = R100 0.050 amps = _________ ohms x 0.050 A = __________ volts.
Similarly, for the 47 Ohm resistor
E = R47 0.050 amps = _________ ohms x 0.050 A = __________ volts.
Plot these two points on your graphs to confirm that the points lie on or very near the lines for the 100-ohm resistor and the 47-ohm resistor.
- Writing an E-I equation for the light bulb.
Consider now the case of the light bulb. Since the E-I curve for the light bulb is not a straight line, how is resistance defined for the light bulb? As a matter of fact, the resistance for the light bulb is defined as the ratio of the voltage to the current just as in the case of the fixed resistors. However the following activity will demonstrate that the resistance is no longer a fixed value.
The E-I curve for the light bulb is shown in the sketch below. Draw two horizontal lines at E = 5 V and at E = 2 V that intersect the curve and drop two vertical lines down from the points of intersection and read the values of I2V and I5V on the milliamp scale.
Record the values, in milliamps, of I2V and I5V on the blanks below, then convert these values to amps by multiplying by 1amp/ 1000milliamps.
I2V = ________ mA x (1 amp / 1000 mA ) = __________ amps.
I5V = ________ mA x (1 amp / 1000 mA ) = __________ amps.
Using the values in amps of I2V and I5V, calculate the resistances R2V and R5V.
R2V = 2 V / I2V = 2 V / ________ A = __________ ohms.
R5V = 5 V / I5V = 5 V / ________ A = __________ ohms.
Clearly the values for R2V and R5V are significantly different, which comes as no surprise since the E-I curve for the light bulb is not a straight line. The process of writing an equation that expresses the relationship between voltage and current for the light bulb is more involved than just recognizing that the resistance is the slope of the E-I curve as in the case of the fixed resistors. A parabolic equation of the form E = k I2 can be derived using any one of the data points. However, the curve will generally pass through the origin and the point that was used to derive the value of k, but other data points may lie a significant distance off the curve. More sophisticated polynomial equations can be derived which pass through all the data points; however the mathematics involved is beyond the scope of this activity.
Use your data for the point near 4.5 volts to compute a value for k:
k = E / I2 = _______ V / (_______ mA)2 = __________ V/ mA2
Use your calculated value of k to generate a predicted E-I curve for the light bulb. For convenience, use the same values for current that you measured in your light bulb test to calculate predicted values for the voltage across the light bulb.
I, mA 0 _____ _____ _____ _____
E = k I2 0 _____ _____ _____ _____
Plot the predicted E-I curve for the light bulb on your original graph for comparison. Does the predicted curve accurately reproduce the test data over the operating range of the light bulb?
Lesson Plan Translation
Downloadable Student Certificate of Completion